Executing Flows In Debug Mode
In Debug Mode, you can execute flows block by block or set Breakpoints to stop at particular blocks.
Note: You cannot edit a flow while you are in Debug Mode.
Note: For some third party Connectors, TIBCO Cloud™ Integration - Connect times out when running a flow in Debug Mode. Use filters in the Query block to reduce the amount of data returned. See Block Properties Filter Tab.
- Open a flow.
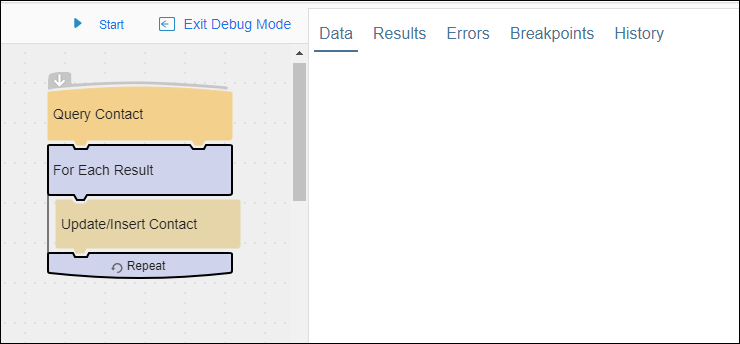
- From the flow workspace, select Debug Mode at the top of the workspace. The Debug tabs open on the right and the Connection panel is hidden:

- Select Start to begin the process and navigate through the first Block. Typically this is the Query Block. The first record found in the Query displays in the Data tab.
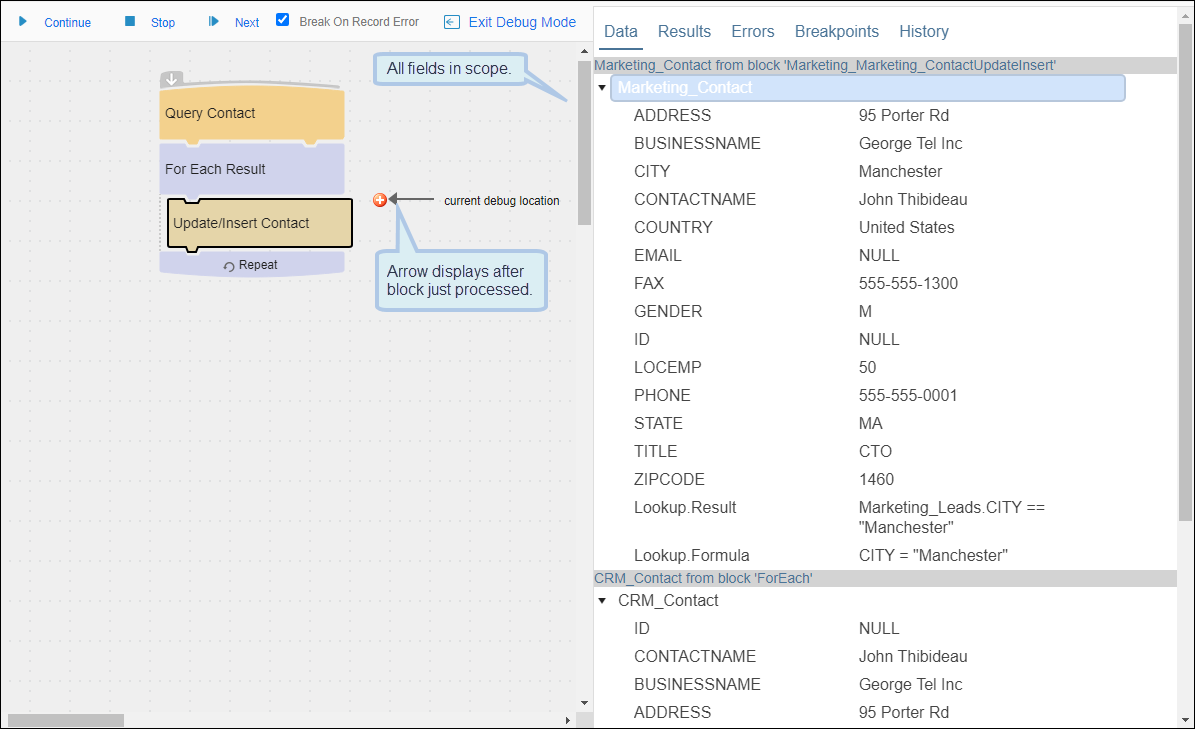
- The Debug arrow displays just below the last Block processed.
- While processing the Query Block, TIBCO Cloud™ Integration - Connect walks through the entire flow and displays anyfields mapped on the Block Properties Fields tab of the blocks in the flow.
- Add Breakpoints to blocks as needed by selecting the block, then from the Gear menu selecting Toggle Breakpoint or Edit Breakpoint to add a Conditional Breakpoint. Breakpoints are optional. Conditional Breakpoints cannot be added until Debug has been started and the first block is processed. See Debug Breakpoints.
- Select Continue to execute the flow in Debug Mode.

Debug Process
- Navigate through the flow using Next and Continue. Select Continue to move to the next Breakpoint or Next to move to the next block.
- If Breakpoints have been set, the Debug arrow displays next to the Breakpoint it has reached. Values from the previous block and inputs for the next block are displayed on the Inputs tab on the right.
- Debug processes the next block in the flow, all blocks down to the next Breakpoint, or all blocks until a record error is found, and then stops again. The arrow moves to just below the processed block, and the workspace displays any records that were changed when the block was executed.
- After each block, examine the data to ensure that you are getting the expected results.
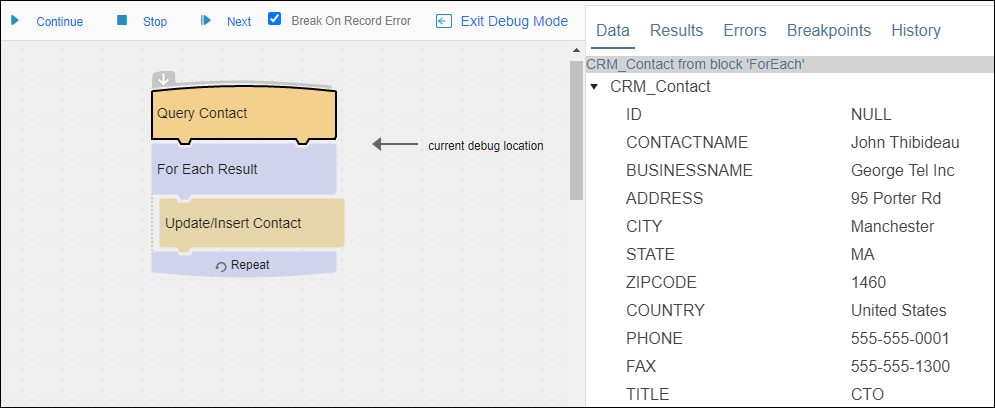
- After this flow finishes executing a single record, the arrow moves back up to the top of the flow.
- You can select Stop to stop Debug mode, select Next again to continue walking through the flow with the next block, or select Continue to move to the next Breakpoint.
- Select Exit Debug Mode to end your Debug session.